
Technologies for Measuring Cell Surface Markers
By Zachary Bradley
Cell Surface Markers
The human body is a complex environment made up of many different types of cells interacting with one another as well as their environment. In order to best be able to understand the numerous interactions, cells need to be differentiated from one another in a recognizable manner. The way we are able to distinguish cell types from one another is by using cell surface markers. Cell surface markers are proteins and carbohydrates which are attached to the cellular membrane, allowing cell surface markers to play an integral role in intercellular signaling. Using the makeup of the cell surface markers present on a given cell, we are able to identify the cell and distinguish it from the surrounding population of cells. Common cell surface markers such as CD3, CD4, CD8 and CD25 are commonly used to identify T cells into their subcategories of cytotoxic, helper and regulatory T cells. Being able to determine the presence and quantity of certain types of cells in a sample can have influences on decisions regarding diagnosis, clinical trial enrollment, drug development and much more.
There are multiple methods available to determine the cell surface markers present on cells within a population. These methods include Flow Cytometry, Immunohistochemistry and Next Generation Sequencing.
Immunohistochemistry (IHC)
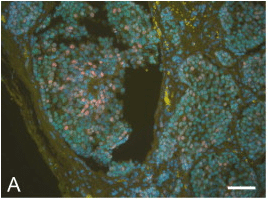
Figure 1: Fluorescent Multiplexed IHC image¹
IHC is a visual technique using microscopy to visualize cellular components in tissue. The technology uses antibodies conjugated to either a fluorescent label (fluorescent detection) or an enzyme (chromogenic detection). Antibodies bind to the targets of interest and their bound reporter allows for a trained professional to interpret the sample to identify the types cells present in the sample. Each type of IHC has advantages or disadvantages to one another such as fluorescent detection allows for greater multiplexing than chromogenic detection but has less sensitivity and is more susceptible to photobleaching than chromogenic detection. IHC allows for the spatial aspect of the sample to be taken into account but can make it difficult to quantify cells in the sample. Multiplex IHC can lead to difficulties in identifying cells as more fluorescence is added and non-specific binding occurs. The analysis of IHC is reserved for highly trained personnel and can still result in discrepancies between pathologists.
Flow Cytometry
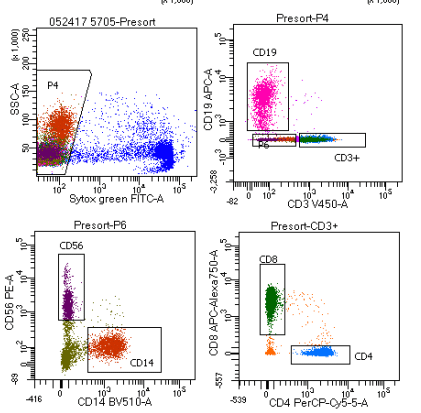
Figure 2: Gating scheme differentiating immune cells
Flow Cytometry is a technique used to detect the presence of cell types within a population by passing single cells through a highly focused laser. Antibodies specific to cell surface markers of interest are added to a sample and allowed to bind to the cells. These antibodies are conjugated to fluorochromes which emit light at various wavelengths. The population of cells is then passed through a laser, exciting the fluorochromes and capturing the light emitted. The cells are then sorted into subpopulations based on the markers present through a series of histograms and dot plots called a gating strategy. Flow cytometry allows for multiple cell surface markers on a cell to be detected allowing for sub populations to be identified. As multiplexing increases, nonspecific binding as well as spectral overlap can become a limitation. Spectral overlap becomes limiting as more fluorescent dyes are added, the more likely they will be measurable by more than one detector.² These limitations must be taken into account when designing the optimal gating strategy to ensure signals are true representations of cell surface markers present. Flow cytometry also does not allow for the spatial aspect of a sample to be analyzed as the cells are suspended and fed through the laser one at a time. As with IHC, there can be discrepancy between sites and technicians as they decide which data points are what type of cell.³,⁴
RNA Sequencing (RNA-Seq)
RNA-Seq utilizes next generation sequencing to sequence cDNA in parallel to create large amounts of data showing the sequence of base pairs found in RNA fragments. cDNA libraries are made by fragmenting RNA into smaller segments followed by using reverse transcriptase to translate RNA into cDNA, amplifying the cDNA and sequencing the cDNA. Sequences are compiled to create a consensus view of the base pairs found in the RNA. RNA-Seq can analyze whole transcriptomes or use a more targeted approach to sequence specific transcripts of interest. While RNA-Seq doesn’t measure the cell-surface markers directly, these same genes have been shown to correctly identify the cell types using RNA-seq (see our comparison to flow and IHC here).
What Next?
Although all three techniques to determine cell surface markers are used in immuno-oncology, RNA sequencing has emerged as the technology with the most potential to enhance precision medicine. RNA sequencing generates copious amounts of data that can be harnessed to identify drug development targets, inform diagnosis as well as identify ideal patients for clinical trials. But, big data is only useful when you extract the most meaningful information. Cofactor builds Health Expression Models, generated through machine learning from the large amounts of data generated by RNA-Seq, which enable more accurate and sensitive measurements of immune cells in the tumor microenvironment. What’s even more exciting, is this technology works on clinical archives and FFPE tissue sections.
Once measured, these immune signals from multiple patients in a cohort may be combined (using Cofactor’s ImmunoPrism Assay) to build multidimensional biomarkers which define patient populations – for example, predict responders and non-responders to treatment. Early results from our clinical studies demonstrate that this sensitive, multidimensional approach is more accurate. This means, as we build diagnostics with this technology, we will be able to save money and time by placing patients with the best treatment sooner.
References:
- Stack, E. C., Wang, C., Roman, K. A., & Hoyt, C. C. (2014). Multiplexed immunohistochemistry, imaging, and quantitation: a review, with an assessment of Tyramide signal amplification, multispectral imaging and multiplex analysis. Methods, 70(1), 46-58.
- Maecker, H. T., McCoy, J. P., & Nussenblatt, R. (2012). Standardizing immunophenotyping for the Human Immunology Project. Nature Reviews Immunology, 12(3), 191–200. doi:10.1038/nri3158
- Pachón, G., Caragol, I. & Petriz, J. Subjectivity and flow cytometric variability. Nat Rev Immunol 12, 396 (2012). https://doi.org/10.1038/nri3158-c1

