
Why are NPV and PPV useful?
By Ian Schillebeeckx, PhD
Predictive Immune Modeling is the discipline of using many facets of immune activity to predict clinical outcomes in research or in the clinic. Core to this discipline, and delivered via ImmunoPrism, is a multidimensional biomarker that considers many immune related readouts (for example CD4+, CD8+, etc abundance and PD1, PDL1, etc expression) of a sample to give a useful clinical or research prediction. Customers can generate their own multidimensional biomarker with ImmunoPrism, by characterizing two groups of samples that define two possible clinical outcomes.
Ultimately, this multidimensional biomarker is a classifier that could serve as a diagnostic. And, like any classifier or diagnostic, the performance of predictions can be evaluated with statistics. Informally, accuracy is often used to evaluate the “goodness” of a classifier. However, trivial examples can show the inadequacy of this metric. For example, imagine a classifier that has 90% accuracy in a set of test samples. At the surface this may seem like a very good classifier. However, upon learning that 90% of these test samples are from the positive group, and the classifier always predicts a sample to be from the positive group, you may reconsider the goodness of this classifier.
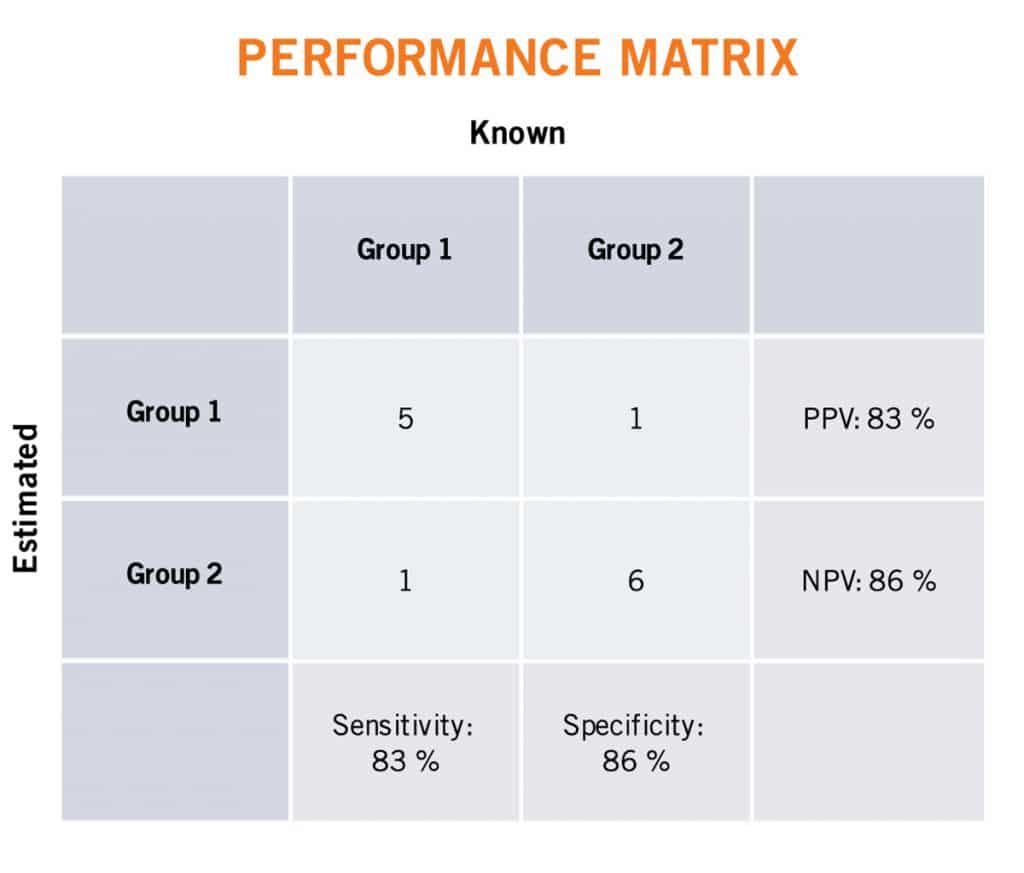
To understand the full performance of a classifier or diagnostic, classically one considers the four relationships between the known condition (positive or negative) and predicted condition of a sample: true positive (TP), true negative (TN), false positive (FP), and false negative (FN). These relationships are succinctly visualized in a confusion matrix, shown below. By considering two of these four relationships at a time, one can more exactly describe the performance of a classifier. Positive Predictive Value (PPV) measures the ratio of true positive predictions considering all positive predictions. Negative Predictive Value (NPV) measures the ratio of true negative predictions considering all negative predictions. Sensitivity measures the ratio of true positive predictions considering all known positive samples. Specificity measures the ratio of true negative predictions considering all known negative samples. These (and other) statistics are reported in the ImmunoPrism multidimensional biomarker report.
For those intent on evaluating the performance of a diagnostic, NPV and PPV are traditionally the most valuable. These two statistics consider the prevalence of the condition and therefore allows one to clinically say how likely an outcome is given a prediction. For example, PPV is the probability that, following a positive prediction, the sample is truly positive. For clinicians, sensitivity and specificity may still be useful, however, as these statistics help one to rule conditions (i.e illnesses) in or out during the course of a patient’s differential diagnosis. For example, for a patient that is predicted to be negative by a highly sensitive diagnostic of a specific condition, then it is reasonable to rule out that condition for a patient.
A perfect predictor would have a value of 1 for all four of these metrics, however, it is exceedingly difficult to develop a perfect diagnostic. Therefore, one must balance clinical and other considerations when creating/training a classifier or diagnostic. Consider the PDL1 IHC assay for determining whether a patient should receive an anti-PD1 therapy. Historically, this test has low accuracy, ppv, and specificity, but high npv and sensitivity. The intent of this diagnostic is to maximize the ability to help those you would respond to the therapy, at the expense of having many would do not benefit. As such, a patient that tests positive for this diagnostic, is unlikely to respond to therapy, making it difficult for physicians to set expectations for patients. In addition, the high number of false positives of this test and the high cost of treatment presents payers with difficult economics.
At Cofactor, we recognize the limitations of PDL1 testing and using single analytes as biomarkers and diagnostics in general. We are currently doing work to use the underlying technology of ImmunoPrism to find a multidimensional biomarker, and subsequently create a diagnostic to replace the PDL1 IHC assay. Our task is to have a biomarker that matches the NPV of the PDL1 assay, but improve on the PPV of the assay and interim results suggest that we are being successful. We are hopeful that a future diagnostic based on ImmunoPrism technology will help clinicians provide higher quality health care to patients in a more efficient way for payers.

