The Curse of Dimensionality
Tiange (Alex) Cui, Ph.D.
One of the most satisfying parts about working in computational biology at Cofactor is the opportunity to identify problems and develop innovative solutions. The “Curse of Dimensionality” is a problem with the relationship between dimensionality and volume. Richard E. Bellman first introduced this idea in his book “Dynamic Programming,” published in 1957.
When the dimensionality increases, the volume associated with the investigated area also increases, but not fast enough for the previously sample points to occupy all the available space, and as a result, it makes the available data spaces empty (Bellman, 1957), resulting in the “Curse of Dimensionality.” For example, 10 evenly-spaced sample points can cover a 1-D (1 dimensional) unit line (Fig. 1A); In a 2-D 1×1 plain, 100 evenly-spaced sample points are needed to cover the whole area (Fig. 1B); When it comes to a 3-D 1x1x1 cube, 1,000 sample points will be needed to cover the entire space, so one can imagine by putting only 100 sample points into the 3-D space, they will appear quite sparsely (Fig. 1C). By adding extra dimensions, data points needed to cover the entire volume increase exponentially. The data structure and correlation in low dimensions does not apply or generalize well in a high dimensional space.
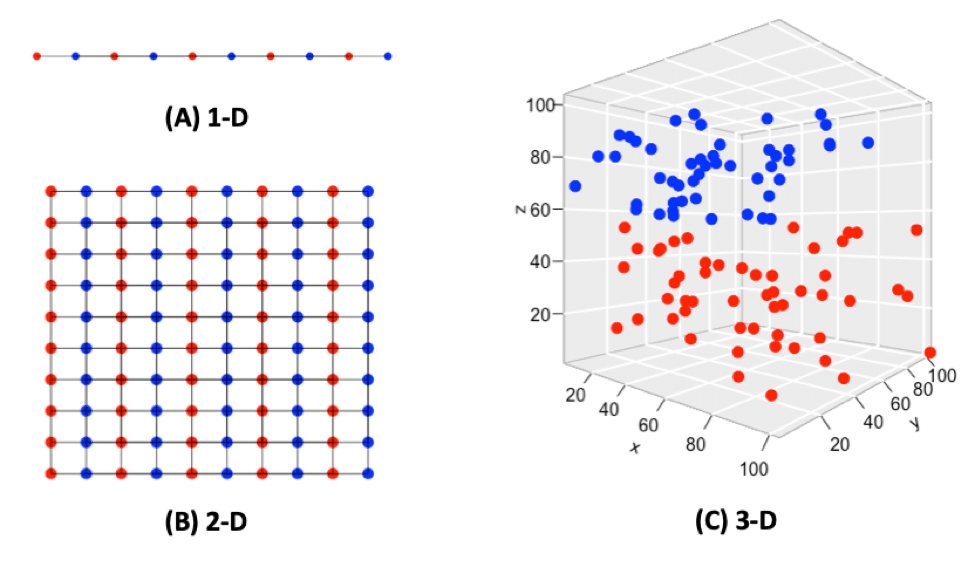
Fig. 1. Points and spaces
Consider an example with a set of sequencing samples from cancer patients, where the goal is to identify the essential differences among them. High-throughput molecular investigations of various tumors were enabled by the recent development of large-scale gene expression profiling technologies, which provided an entirely new platform to investigate tumor’s underlying tissue, the tumor itself, and its remote metastasis. However, tumor gene expression profiles, especially these obtained using next-generation sequencing (NGS), have several noticeable features to make analysis difficult: multivariate nature of resultant data, its high dimensionality, (relatively) small sample size, a variety of associated confounding factors, and nonlinearity. To deal with these issues, we first need to choose the representative features that contribute most to the prediction variables or output from samples: a process called Feature Selection (FS). In terms of tumor samples, the most commonly used features are tumor size, tumor grade, pathological findings, recurrence/regression history, survival/metastasis status, etc. However, among all, the most important feature is the expression profile of each sample, which is largely determined by the genes of selection.
Scientists once suspected there are over 100,000 genes in the human genome, but with the completion of the Human Genome Project (HGP) and large genomics consortium projects such as 1,000 Genomes, Genotype-Tissue Expression (GTEx), ENCODE, etc., scientists now believe that there may be as few as 19,000 protein-coding genes in our genome (Tress, 2014). Steven Salzberg and his team from Johns Hopkins University in Baltimore, Maryland used data from GTEx and proposed a total of 21,306 protein-coding genes and 21,856 non-coding genes (Salzberg, 2018). With the powerful NGS technologies, scientists are able not only to sequence the whole genome or exome but also to use targeted sequencing to sequence a subset of genes or specific genomic regions of interest in a cost-effective manner. However, with the popular sequencing panels, researchers are still looking at thousands of genes all at once. In order to generate a robust gene selection with acceptable predictive performance and desired level of reproducibility, the curse of dimensionality kicks in, and thousands of biological specimens will be needed (Domany, 2006). Domany and his collogues showed that the number of samples needed to achieve a desired level of overlap between a pair of Predictive Gene List (PGL) produced from two randomly chosen training sets are quite large. As Table 1 shows, to achieve a 50% gene overlap between a PGL of 70 genes (van de Vijver, 2002) and a PGL of 76 genes (Wang, 2005), 2,300 samples and 3,142 samples will be needed respectively.
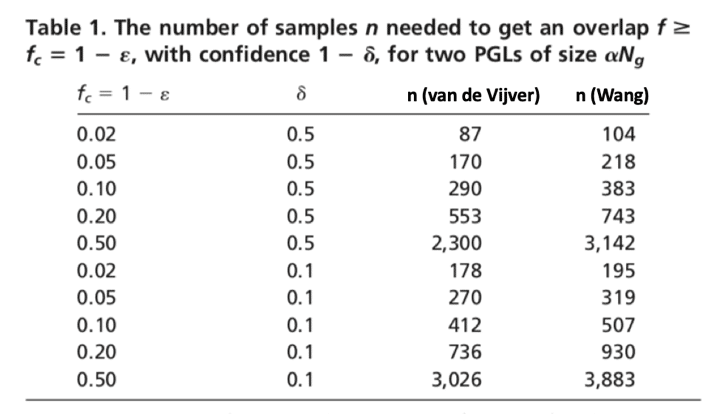
Table revised from Domany et al., 2006
In reality, it’s nearly impossible to sequence thousands of samples for just one project, so in order to pick a more refined set of PGL to reduce the effect of the curse of dimensionality and lower the number of samples that are needed for the experiment, one approach is to minimize the PGL. At Cofactor, we have developed a reduced capture method with a defined number of genes for tumor profiling in our ImmunoPrism™ assay, tailored specifically to include the genes required to quantify key immune cells and immune signals. However, this approach is far from limiting. By considering multiple facets of biology, looking at both the presence and absence of RNA, as well as the dynamic expression levels that can be influenced by the state of the disease or other factors such as therapy/treatment regimens,there is a better chance to understand disease and accurately predict therapy response. When building these multigenic models of immune cells, or Health Expression Models as we call them, we take an unbiased approach – leveraging machine learning – to identify the genes that uniquely define immune cells in complex mixtures. With a minimum set of PGL, we are able to capture the full picture of the immune response in the tumor with the context of clinical data using Predictive Immune Modeling. This enables our ImmunoPrism™ assay to generate multidimensional biomarkers which provide a multi-faceted representation of a patient’s immune response, their response to therapy, and potentially, the overall prognosis of their health outcome.
I’d like to say that we’ve beat the curse of dimensionality. In a time when everyone is talking about “big data”, we know that data needs context. At Cofactor, we are focusing on deriving insight and, more importantly, utility from this data. We capture the complexity of biology and distill it into something interpretable and meaningful for use in precision medicine. This solution provides unprecedented accuracy and sensitivity for immune profiling, which allows our partners and clinical collaborators to better characterize immune response at the site of the tumor.
Note: Cofactor’s ImmunoPrism™ Assay is offered both for Research Use Only (not to be used as a diagnostic assay) and as a CAP-validated assay. Please contact us to discuss which option is right for your application.
References:
Bellman RE (1961). Adaptive Control Processes. A Guided Tour. Princeton University Press, Princeton, NJ
Ezkurdia I, Juan D, Rodriguez JM, Frankish A, Diekhans M, Harrow J, … Tress ML (2014). Multiple evidence strands suggest that there may be as few as 19,000 human protein-coding genes. Human Molecular Genetics, 23 (22): 5866–78
Pertea M, Shumate A, Pertea G, Varabyou A, Chang YC, Madugundu AK, … Salzberg S (2018). Thousands of large-scale RNA sequencing experiments yield a comprehensive new human gene list and reveal extensive transcriptional noise. bioRxiv, 332825
Ein-Dor L, Zuk O, Domany E. (2006). Thousands of samples are needed to generate a robust gene list for predicting outcome in cancer. Proceedings of the National Academy of Sciences, 103 (15), 5923-5928
van de Vijver MJ, He YD, van’t Veer LJ, Dai H, Hart AAM, Voskuil DW, Schreiber GJ, … Bernards R (2002). A gene-expression signature as a predictor of survival in breast cancer. New England Journal of Medicine. 347:1999–2009
Wang Y, Klijn JG, Zhang Y, Sieuwerts AM, Look MP, Yang F, … Foekens JA (2005). Lancet, 365, 671– 679.
