Two weeks back I attended AGBT and had such a great time I thought I would share some highlights from our collaborative research with Pacific Biosciences.
The motivation: Cofactor has solutions for a lot of challenging RNA samples, low quality, low quantity and clinical RNA sequencing (CLIA). As you will see below another challenge is identifying novel isoforms and gene fusions using short read technology.
The challenge: Identifying novel isoforms and fusions.
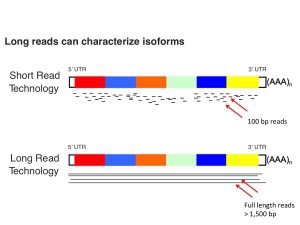
Figure 1. Short reads are great, don’t get me wrong, but the above image highlights an example of the difficulty in putting transcripts back together and “phasing” exons with short reads. Sequencing through the entire molecule gives us the best representation and highest confidence for identifying novel isoforms from 5ʹ to 3ʹ.
The problem: Current protocols requires a large amount of starting material and are cost prohibitive for discovery purposes.
The approach: Simplify library construction and normalize the dynamic range of the transcriptome to identify more unique/novel isoforms in the transcriptome.
A. Low, Medium and High Abundance Transcripts

B. Reduce High Abundance Transcripts

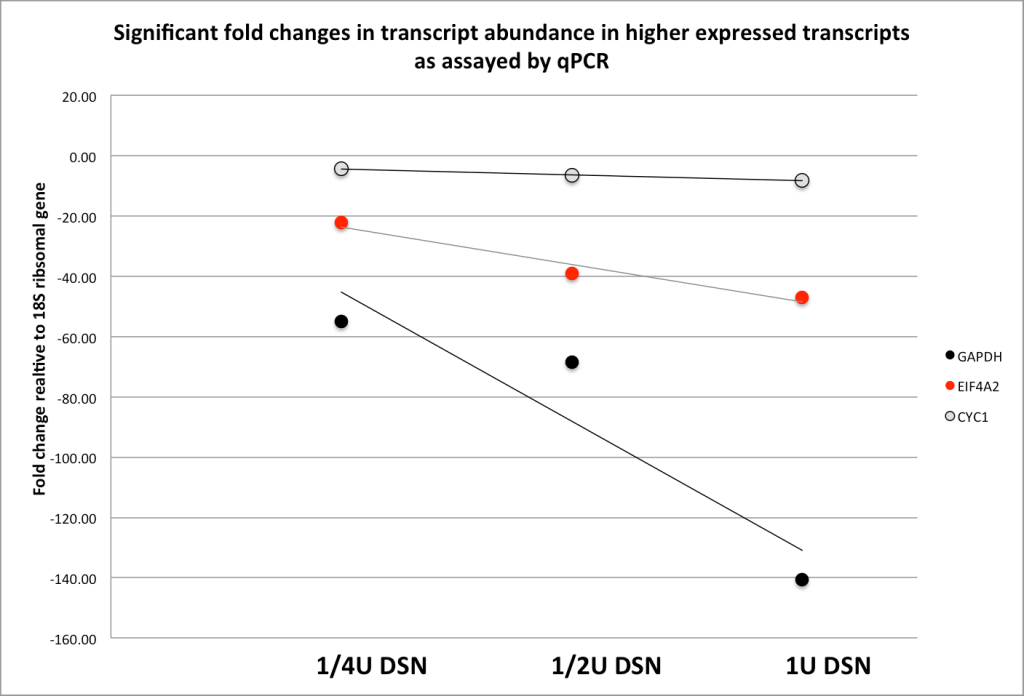
Figure 2. To assess and optimize the effects of DSN on the transcriptome, we monitored 3 transcripts A. low (CYC1), medium (EIF4A2) and high expression (GAPDH) relative to the 18s ribosomal transcript (y-axis is fold difference). B. We optimized DSN treatment by varying enzyme concentration and its affect to significantly ‘knock down’ high abundance transcripts but have minimal effect on medium and high abundance transcripts.
The Solution: Detect >100% more isoforms than control non-normalized approaches.
Increase Discovery of Unique Isoform by >100%

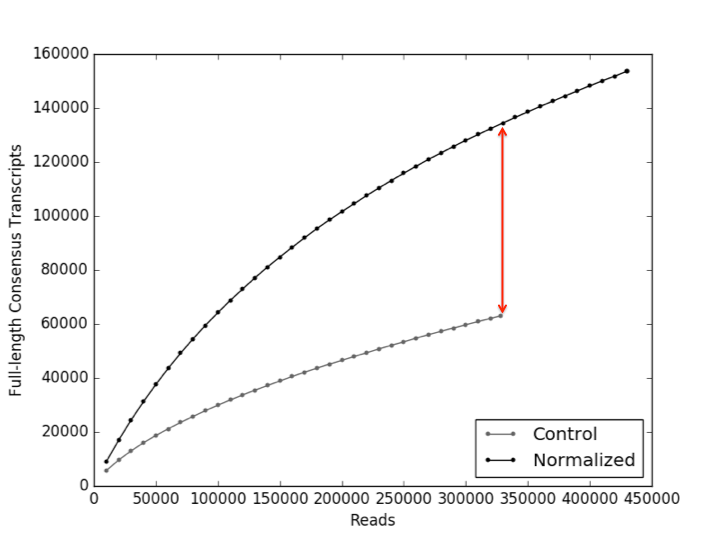
Normalized libraries have >60,000 (>100%) more unique transcripts at the same sequencing depth (red arrow).
Figure 3. To assess the amount of unique isoforms in our protocol relative to a control we plotted both samples on a saturation curve. To orient you to the graph, the Y-axis is the number of unique isoforms and the X-axis is the # of reads generated. The red line highlights the difference between the two approaches at the same sequencing depth. Put another way, with our approach, the same amount of money spent on each sample yields >60,000 more unique isoforms.
We call it AllSplice: Find out more about Cofactor’s AllSplice approach by getting in touch with one of our Scientists.
Thank you: To my collaborators at Pacific Biosciences, Matt Boitano, Steve Kujawa and Tyson Clark. Also, a big thank you to Ajay Khanna, one of Cofactor’s bioinformatics wizards that helped me put a lot of these graphs together.


