Machine Learning: A Digestible Explanation
By Brent Wilson, PhD
As a Project Scientist at Cofactor, I provide generalized, digestible explanations to our customers after speaking with the various technical experts at Cofactor. One of the topics I cover often is Machine Learning. Introducing machine learning in the context of computational science and outlining how we utilize this tool at Cofactor can sometimes be difficult.
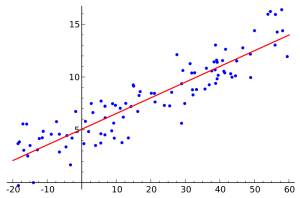
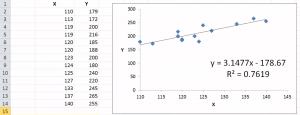
With that in mind, I’ve always held that the best way to learn something new is through comparison to something you already know. Since our audience typically consists of scientists (many, many varieties of scientists), the most nearly universal starting point for machine learning may well be “trendlines” within Microsoft Excel.
Then, minimize a function of the difference between the line and actual values (the cost function):
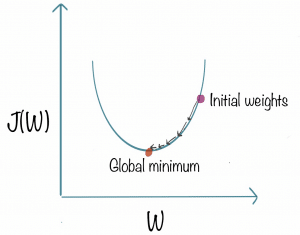
By taking partial derivatives with respect to a0 and a1, you may update the values of these parameters to continually decrease the cost function. This will result in a line of best fit for the data.
These principles apply equally well to systems or plots of points with N-dimensions. Though the math becomes an issue for a human, a computer has no trouble generalizing to as many dimensions as a system has variables.
This is where the power of machine learning lies – in the ability to find patterns where a human eye would have difficulty. Personally, I have a lot of trouble visualizing anything beyond three-dimensions, so this is where machine learning algorithms are helpful and also more reliable.
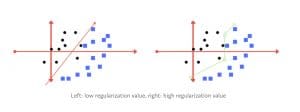
However, there is an art to the practice of data science. Human input is often needed for an algorithm to provide the most predictive power. One example is that of regularization:
The figure on the right may be less robust to future data points because it focuses so much on not misclassifying two data points in the training set. A successful data scientist considers these trade-offs to build the most powerful approach.
In building ImmunoPrism™, our analysis team invested countless resources to provide the most robust method for our Predictive Immune Modeling platform. This process is still ongoing and involved not just mathematical knowledge, but also Cofactor’s experience in working with RNA to continually, build, test and improve the calculations used in ImmunoPrism™.
Questions about Cofactor or our product offerings? Reach out to schedule a time to speak with one of our Project Scientists today.


