Part 5 of our 6 part series on RNA-seq. Part 1, Part 2, Part 3, Part 4
5. Estimate the number of biological replicates and reads needed to accomplish your goals…. before you start sequencing!
I have attended many analysis consultation meetings where people ask about statistics associated with singlet or duplicate sample RNA-seq, and we tell them we are really “throttled” in this situation. Our clients are super-intelligent, and Cofactor has spent sufficient time planning the experiment with them so this is not a big deal and they knew that going in. Point is, there are already innumerable areas for surprises to occur during a next-generation sequencing project (hard drive dies on a sequencer 11 days into a paired-end 100 bp run… ugghh), and the last place they should occur is after the data is analyzed. If you find this has happened to you more than once with the current company you are working with, RUN… do not walk away from them!
Here is a pretty simplistic breakdown of the different sample numbers we see and what we can and cannot do:
Singlet – great for skim experiments that are budget constrained. If you want to see if your suspect genes are differentially expressed, generate some data for a grant (although even this changing) or convince an entity that there is value in performing further RNA-seq experiments, singlets might work perfectly (just make sure they don’t ask why you didn’t perform replicates).
Duplicate – This is what we see most often when people have a certain budget but want to include as many conditions as possible. This type of experiment is associated with what we call a “phenotype scan” where an investigator wants to assay many phenotypes in one experiment for genes that may pop out, above noise. In most cases, we will be performing follow-on experiments, which may include increased replication. We will consult with the client to make sure that they understand that they are trading confidence in candidates for reduced replication and everyone is happy.
Triplicate – In this category of replication we are able to apply additional statistics to increase confidence in candidates and reduce Type I and II errors as much as possible. Statistics like p-value, coefficient of variance, and false discovery rate can be calculated with triplicates. If you require these statistics for your experiment, you need to do triplicates. If you would like these statistics for your experiment, please talk to Dr. Jowdy or Dr. LaFranzo at Cofactor to figure out how we might be able to get you there with your current budget.
Taking the above into account, you might ask, why do I even need replication and what power does it provide? Well, it has been stated before but with RNA-seq, really what you want to know is whether the difference between two samples with different treatments is stronger than what you expect to see between replicates, because otherwise, you cannot attribute the difference to the treatment.
Let’s zoom out of replication for a second to consider the real “umbrella” that resides over all of the above.
One of the more understood triangulations for an RNA-seq experiments is:
1. Cost
2. Read Count
3. Replicates
Our goal is to make your experiment wildly successful, thus we will force you to discuss these three points with us (OK, force may be too strong of a word, but we will sternly mention it several times!). The pluses and minuses of these points should be well understood before samples even ship to Cofactor.
There are multiple “freeware” or open-source tools available and ones that we have developed in-house at Cofactor to help you understand the specificity, sensitive, and accuracy of your RNA-seq experiment. We want to bring an end to the question, how many reads do I need to perform differential expression? There are as many answers to that question as there are read counts on an ILMN lane. However, it is easy to understand that you cannot detect differential expression in a gene if you did not sequence reads from that gene. We have generated literally hundreds of saturation curves for RNA-seq data from many different types of samples. We can use these, during our upfront discussions to help you decide on an appropriate depth of sequencing for the goals of your experiment. An example saturation curve is shown below.
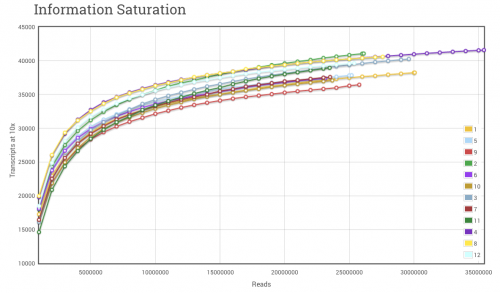
Figure 1. RNA-seq Saturation Curve. The saturation curve above displays the number of transcript references with < 10 read alignments at bins of 1 million reads. As additional reads are cumulatively added to the alignment set, hits to transcript references increase very rapidly at first, and then level off to become asymptotic to the upper limit. The upper limit in RNA-seq experiments will be defined by several factors, not limited to, number of maximum sequencing reads, number of transcript/isoform references and complexity of the original RNA pool.
There was a paper published last year, RNA-seq differential expression studies: more sequence or more replication? [1], that we thoroughly examined at Cofactor and mostly agree with (come on, were are scientists… we can’t agree with everything). I will quickly mention that we do agree, additional replication is preferable over adding arbitrary depth. With that said, as shown in the paper, when moving from 10 – 30 MM reads with 2 or 3 replicates, one will pull in approximately 25% more differentially expressed (DE) genes. The authors state that there are diminishing returns with sequencing greater than 10 MM reads and technically speaking, this is correct. The graphs at an FDR of 0.05 do show diminishing returns. But, let’s call a spade a spade…..many of our clients, with the decreasing cost of sequencing, would rather do the 3 replicates and 20-30 MM reads as opposed to 7 replicates at 10 MM reads. The one point the authors did not mention is that they also show diminishing returns with replicates greater than four. And, with the cost of generating RNA-seq libraries driving much of the total cost for RNA-seq at 10 MM reads per sample, I think it is misleading to talk about budget, replication, and read counts without looking at real world examples. Thus…. It is my duty to give you a real world scenario:
Here is the setup:
12 total samples (1 control and 5 conditions in duplicate)
1×50 bp sequncing for differential expression (no alternative splice discovery happening here)
10 MM reads per samples (12 samples in one lane of ILMN HiSeq)
or 30 MM reads (4 samples in one lane of ILMN HiSeq).
By the way, notice that I did not fudge the numbers by saying 15 or 20 samples in one lane! This is TOTALLY bogus when people do this. As you increase sample multiplexing, you also increase read count variability across samples and have to bring your total reads per lane estimate down. Please thank our wet-lab Director, Dr. Sara Ahmed, for that nugget of wisdom.
Ok, taking the above into account, adding 3x more reads per sample (from 10 MM to 30 MM) increases the total price of the project 1.5x. Not too bad for 3x additional data. Adding an additional replicate for each sample (18 samples total now – triplicate at 10 MM reads each) would increase the total price of the project 1.6x. Ok, a little different view now.
Based on the paper… what do you get from each of the two scenarios above (based off Figure 1A in the paper). increasing read counts for your samples from 10 – 30 MM reads per sample provides an additional ~25% more DE genes (at 1.5x the cost), while increasing the replicates from 2 to 3 at 10 MM reads per sample nets you an ~35% more DE genes (at 1.6x the cost). To be fair, Figure 1b in the paper shows a greater difference in statistical power for FDR when increasing from 2-3 replicates as opposed to adding additional data. Ponder this for a second though, you cannot detect differential expression for a transcript if you did not sequence enough reads to disambiguate it from noise, and to take it one step further, you certainly cannot determine differential expression for a gene if you did not sequence it at all…..So, don’t go out and figure you’ll do 1 million reads for all your samples, bad idea!
Alright, enough of my crazy analysis! I told you that we have looked at the paper pretty closely! Anyway, the take home point here is that there is a fine balance between additional reads, replication, and budget… which is totally defined by the goals of your study. We are experts at helping our clients find the best way to attain this balance and actually get a kick out of the challenge.
If any of the above confuses you or you have additional questions…. don’t call me! Just kidding… actually Dr. Jowdy and LaFranzo know this stuff better than me and geek out on it as well.
Next time I am going to talk about noise in RNA-seq data and how you go about figuring out the how’s, why’s, and where’s to filter it. FUN, FUN, FUN!
1. Liu, Y., Zhou, J., and White, KP., (2014) RNA-seq differential expression studies: more sequence or more replication? Bioinformatics Feb 1;30(3):301-4.