Not advice you would expect from someone who has spent their entire career sequencing and analyzing DNA. But this advice helps Cofactor answer the number one question asked at the start of the thousands of successful sequencing projects we’ve completed. The question? “How many reads do I need?”
In our field, there has historically been three ways to find your answer; (1) Discussions at a conference lunch table, (2) Using first hand knowledge of similar, successful projects as a guidepost, (3) Creating a feedback loop between sequencing and analysis, tracking project discovery rate as a measure of when to stop sequencing. This last technique is especially attractive given the uniqueness of each sample, library, and sensitivity/specificity goal for each project.
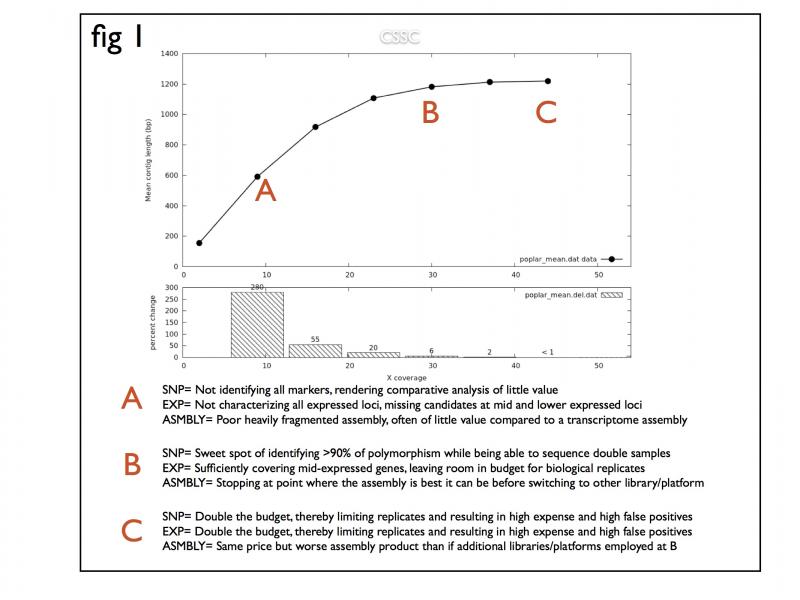
Last year we initiated an R&D project aimed at maximizing project success while minimizing project price. The result was Cofactor’s sequencing saturation curves. The saturation curves track discovery as a measure of input reads. Discovery is considered application specific (for SNP, De-novo assembly, RNA-seq), however the concept is broadly applicable across almost all of our project types. If your project sequences well past saturation it can represent a significant waste of funds. On the other end, stopping sequencing before saturation results in missing potentially valuable candidates. Figure 1 below shows the interpretation for each of the application types.

Cofactor’s saturation curves help us not only answer the important question of how many reads are needed for a given project, but also serve as a key qualitative QC measure to determine if you have reached your targeted sensitivity. Hitting this balance between budget and discovery allows us to tailor the experimental design to each researcher. Many times the savings associated with this approach allows us to introduce more biological replicates into the design to make the best use of the ever increasing sequencing capacity. How many reads are you targeting in your next-gen projects and why? With Cofactor’s saturation curves, you’re ensured the highest discovery rate at the lowest cost. It’s in our D&A


