Transcriptome alignments for RNA-seq experiments typically result in a list of tens of thousands of expression values for each sample, most with some difference between samples, including between biological replicates. At Cofactor, our goal is to help researchers filter this data down to a list of candidates for further investigation. One filtering tool we provide for experiments with biological replicates is a per-transcript P-value.
Let’s look at an example from an actual RNA-seq experiment. This experiment has a control group A and an experimental group B of three replicates each. Here are the results for two transcripts t1 and t2
| t1 group A | t1 group B | t2 group A | t2 group B | |
|---|---|---|---|---|
| replicate 1 | 0.13 | 23.28 | 0.20 | 37.19 |
| replicate 2 | 0.95 | 22.72 | 0.38 | 5.74 |
| replicate 3 | 0.39 | 22.16 | 0.22 | 3.08 |
| mean | 0.49 | 22.72 | 0.27 | 15.34 |
At first glance, t1 and t2 seem to both show differential expression. For both transcripts, the mean expression level of group B is manyfold that of group A, and the sums of the expression levels across both groups are high enough that we are out of the low-level noise that we always observe in RNA-seq experiments.
A closer look at the replicates within each group shows that in t1 group A and t2 group B there is high variation between replicates relative to their mean.1 But for t1, the difference between replicates is small relative to the difference between the means of group A and group B, while for t2, the difference between replicates is more than twice the difference between the means. This suggests that the apparent differential expression of t2 is more likely to be due to variation between replicates than t1.
Can we summarize all of the above with just a few numbers that we can use to sort and filter the data? Here are the same two transcripts in part of our ActiveSite viewer.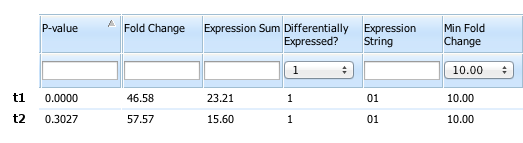
By setting the “Differentially Expressed?” flag to “1”, we have already filtered the data to a selectable minimum “Fold Change” and “Expression Sum”, and the “Expression String” shows that it is group B that shows higher expression. The “P-Value” comes from a t-test2 performed between group A and group B and serves as a measure relating variation between replicates to the difference between groups. While we cannot interpret this P-value as a specific probability3, it does serve our purpose as a way to compare transcripts. Here, the higher P-value of 0.3027 for t2 versus less than 0.001 for t1 reflects our inference that the observed expression in t2 is more likely to be due to variation between replicates. We can now filter and sort further on any of these values.
P-values become another tool researchers can use to quickly gain insight into their data. With more and more data being generated by next-gen sequencing, this insight becomes important to go from a mass of data to discovery.
[1] Variation relative to the mean is summarized by the coefficient of variation (CV) statistic. Though not shown here, the CV and other statistics can also be used as filters in ActiveSite. [2] We use a two-tailed, unequal variance (Welch’s) t-test. [3] Because we do not know the distribution of expression levels in the population we’re sampling from and we have sampling bias. These are both areas of active research.