Biological data is complex. Possibly some of the most complex genomics data is that which tries to capture the RNA, or transcriptome, that is active in a sample. A central theme to our research and development is representing large complex data in new ways in order to aid in assessment and discovery. Below are 3 pictures that tell a story of transcriptomes and in my opinion do so in a way that can not be as effectively told in either text or numbers. Enjoy.
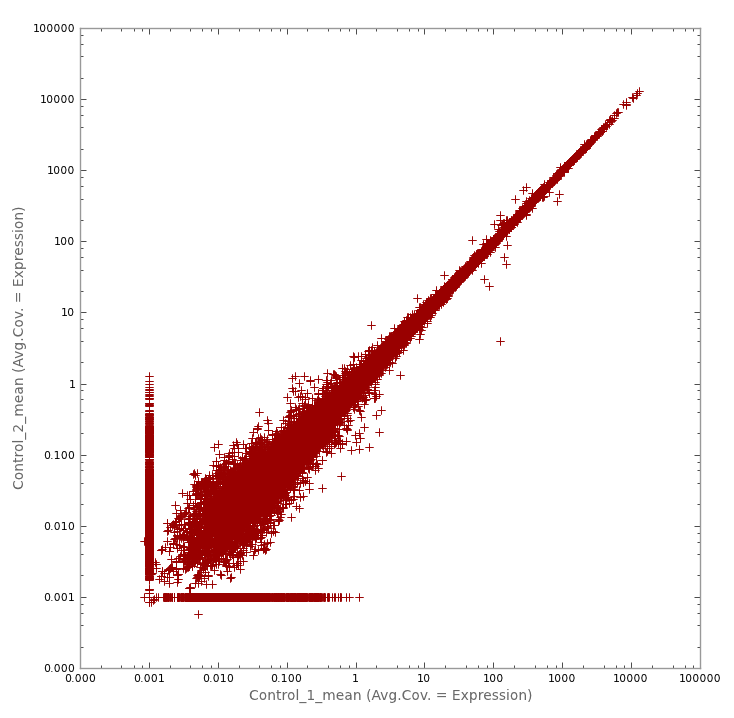
A. microRNA in mouse model of disease
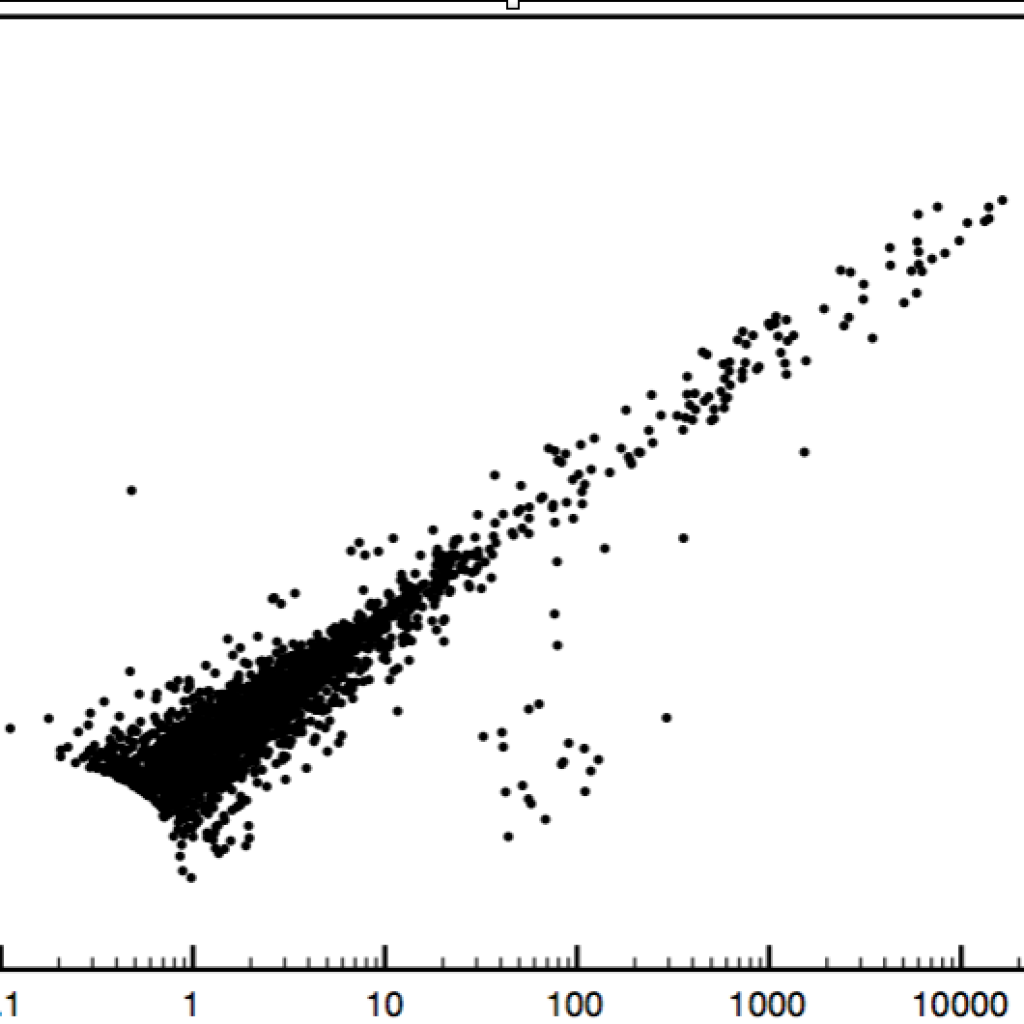
B. Transcription of Fungal pathogen prior and post infection of wheat host
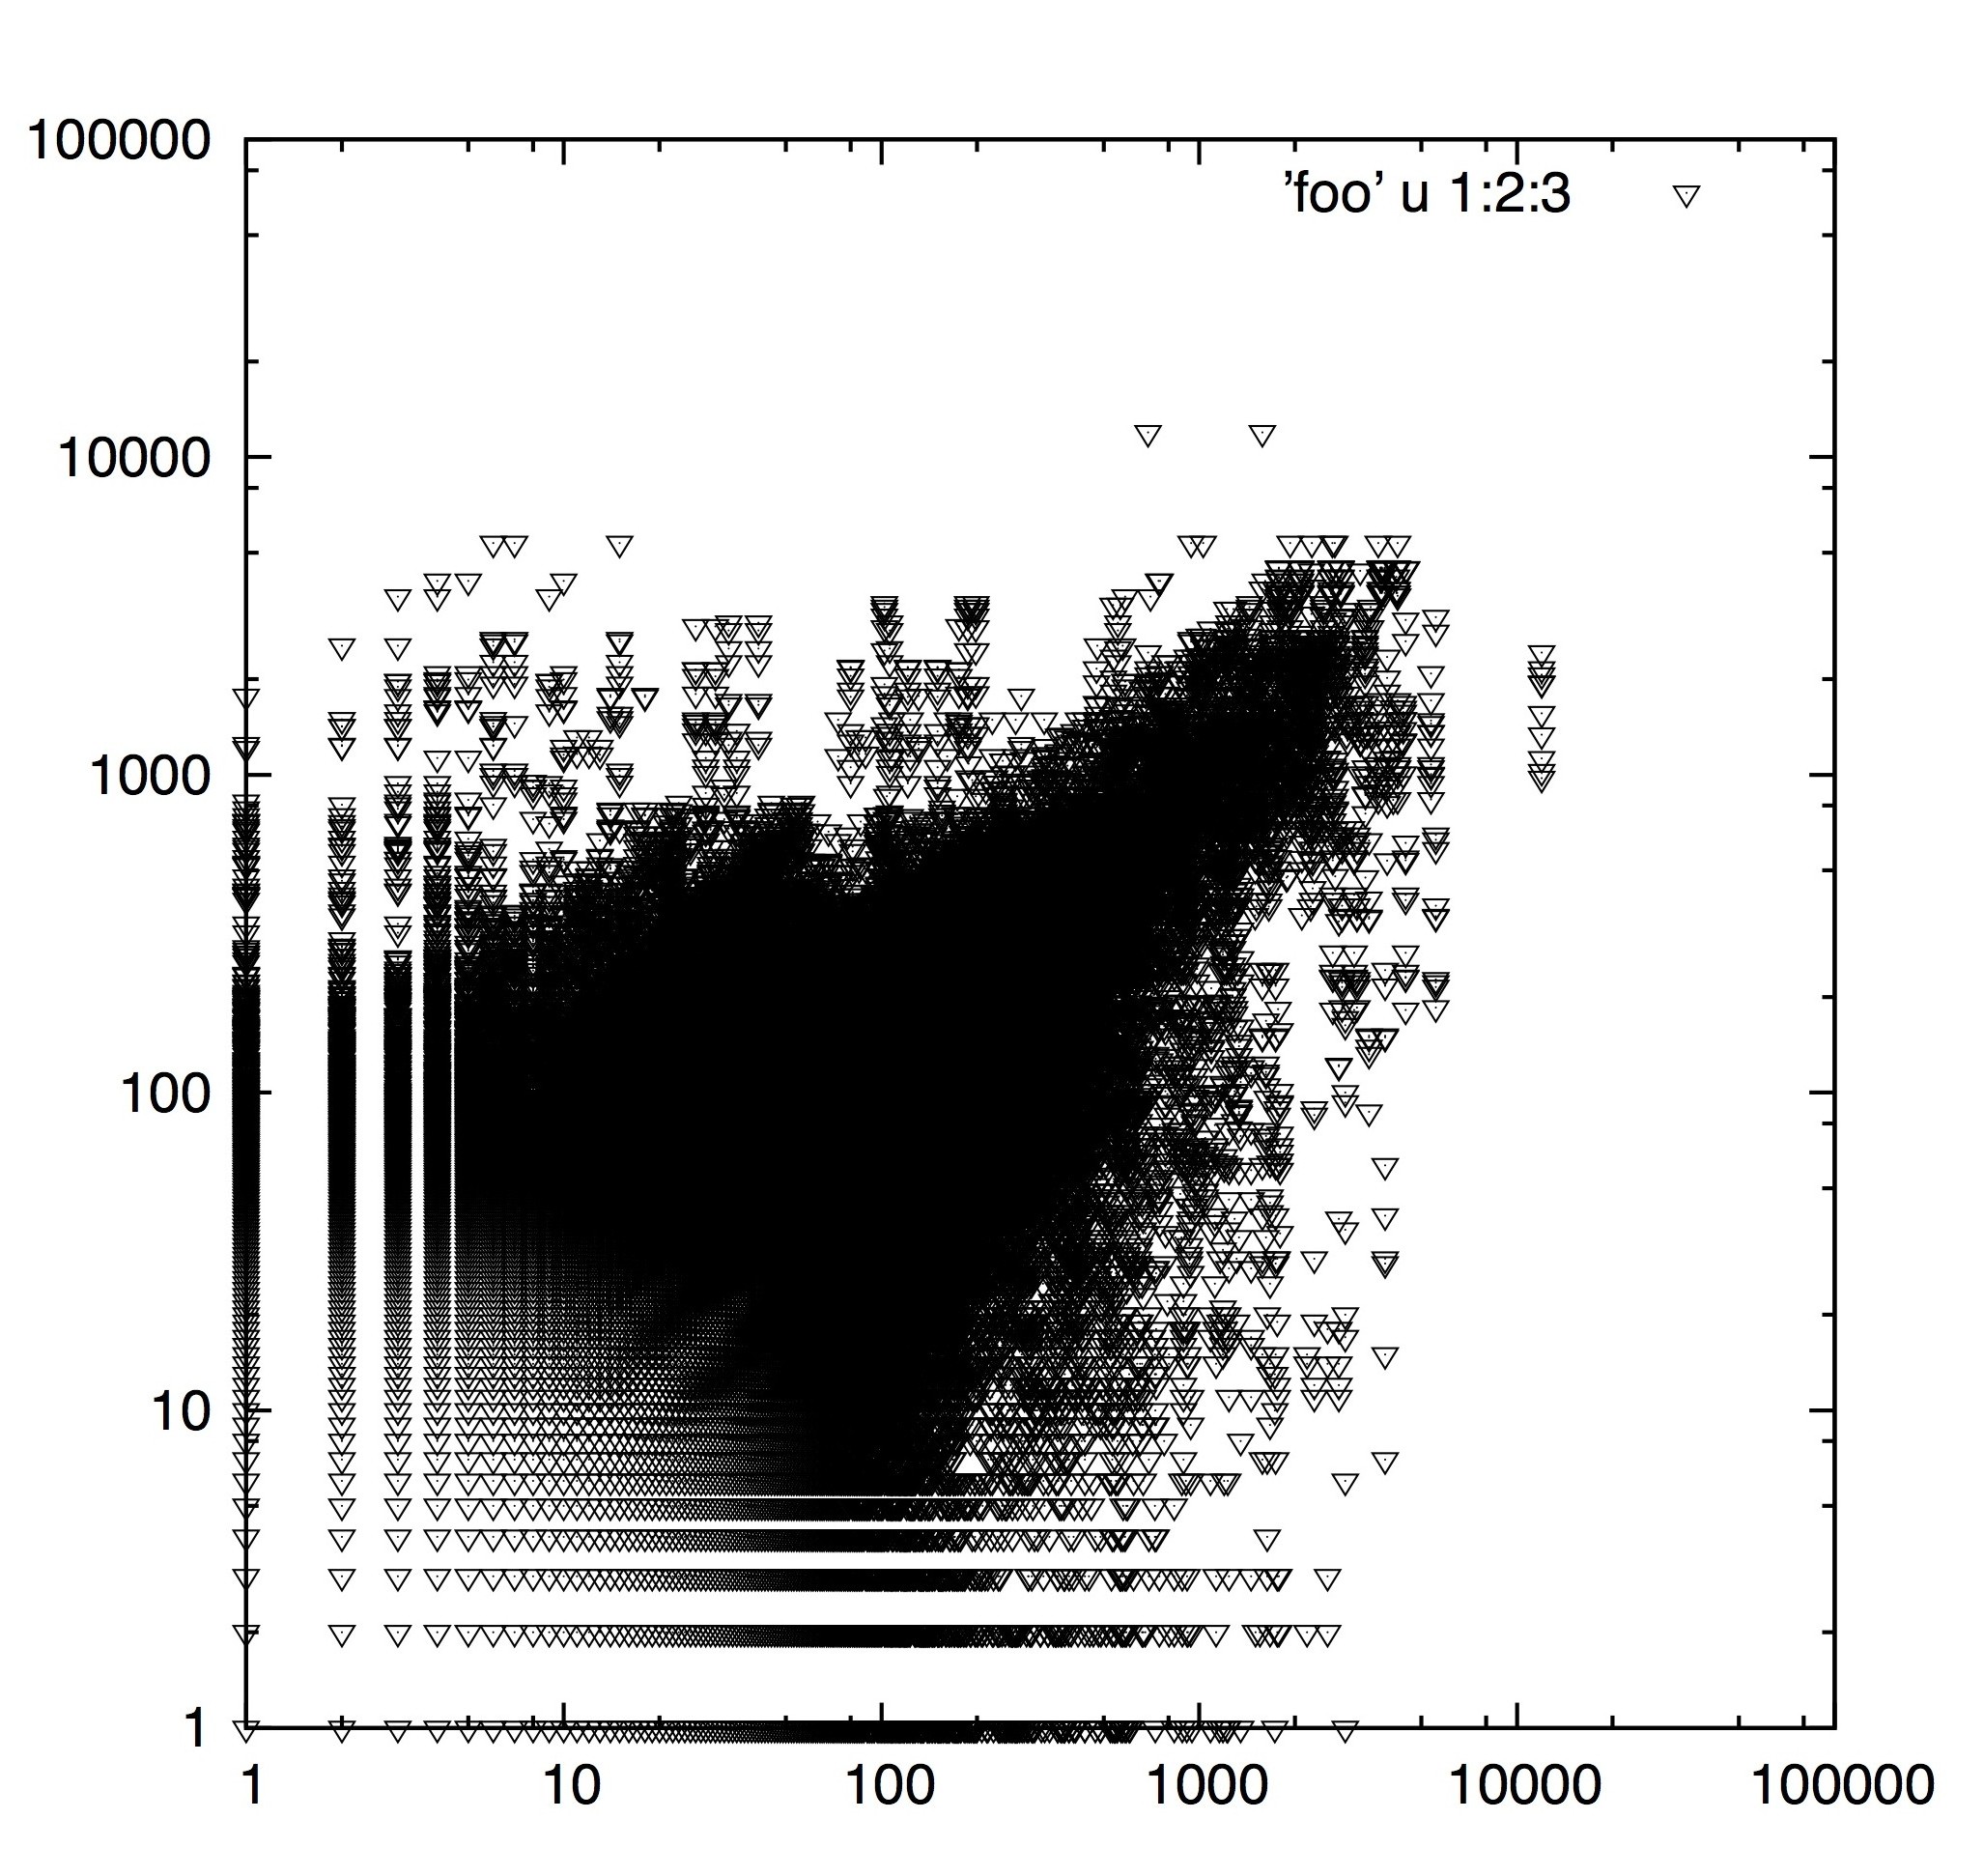
C. Biological Replicates of Algal strains.
(1) MicroRNA in mouse model of disease. Best Behaved. Replicates are usually well behaved, but this experiment showed just how well behaved things could be. A sharp spire over 5 orders of magnitude.

(2) Transcription of Fungal pathogen prior and post infection of wheat host. A picture of Discovery! This is a favorite for two reasons, one because it is the result of a comparative expression study using a transcriptome assembly we built for the project (ie no genome necessary) and two because it shows a clustering of genes showing differential expression (70% of which were previously implicated in other studies). A beautiful picture of expression that resulted in a great publication:
Bruce M, Neugebauer KA, Joly DL, Migeon P, Cuomo CA, Wang S, Akhunov E,
Bakkeren G, Kolmer JA, Fellers JP. Using transcription of six Puccinia triticina
races to identify the effective secretome during infection of wheat. Front Plant
Sci. 2014 Jan 13;4:520. doi: 10.3389/fpls.2013.00520. eCollection 2014 Jan 13.
PubMed PMID: 24454317; PubMed Central PMCID: PMC3888938.
(3) Biological Replicates of Algal strains. Biology can be messy. This project reminds me that transcriptomes can be complex (especially when you fish it out of a pond), and therefore you have to understand complexity and variability of the transcriptome(s) before thinking you can find the one gene or pathway responsible for the difference in phenotype.


