The Candidates page typically has three tabs: Transcriptome, Transcriptome Pairwise and Genome.
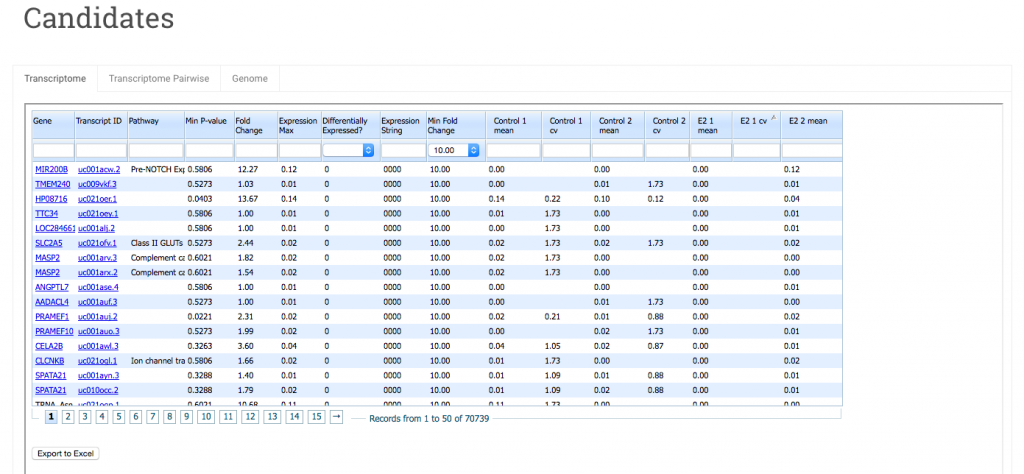
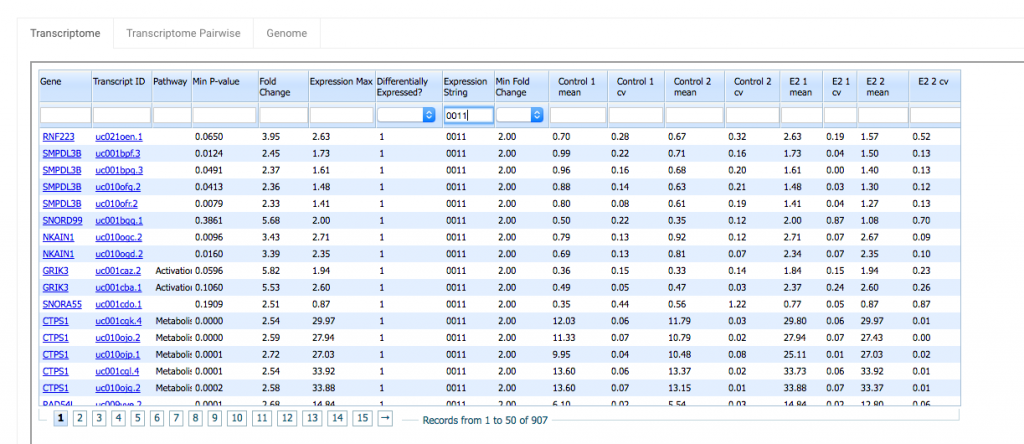
The Transcriptome tab contains comparative expression data for your sample groups, one row per transcript.
You can sort the data in a column in ascending or descending order by clicking on the column header. Also each column has a search field you can use to filter your data.
Here’s a quick run down of each column.
Gene – This is the gene name of the transcript. Click on the name to link out to the transcript record at NCBI.
Transcript ID – The transcript identifier. Clicking on the link takes you to this transcript in the UCSC genome browser.
Pathway – (For human and mouse) Pathway annotations are curated by expert biologists and provided by the Reactome database. The current version (49) annotates 7357 human genes in 1551 pathways.
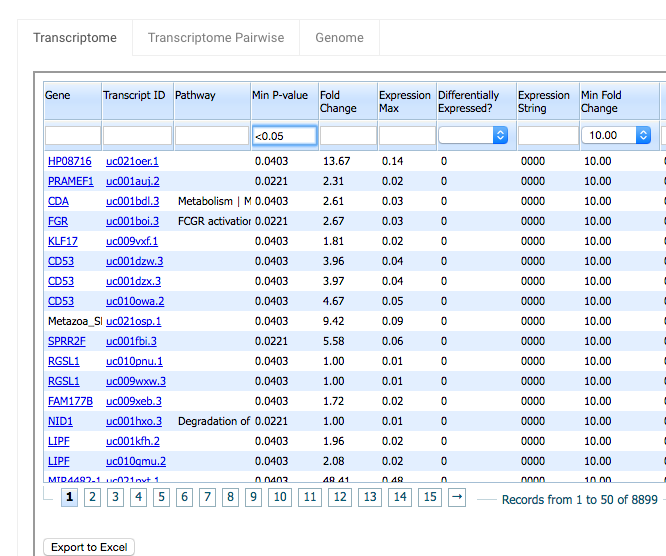
Min P-value – In this view the displayed P-value is the minimum of all the pairwise P-values between groups. The P-value is a Welch’s t-test. That is, a test of the null hypothesis that the means of two normally distributed populations are equal, assuming unequal variance. Smaller values are more significant. P-values are then corrected for multiple testing using the two-step adaptive method of Benjamini and Hochberg (2000), which estimates the true number of null hypotheses to control the False Discovery Rate.
You can use the search box underneath the Min P-value column header to filter by p-value. For example, if you only want to see the rows with Min P-values less the 0.05, type “<0.05” in Min P-value’s search field. Note that when you filter using a P-value <0.05, the number of records returned is reduced from over 70,000 to 8,899.
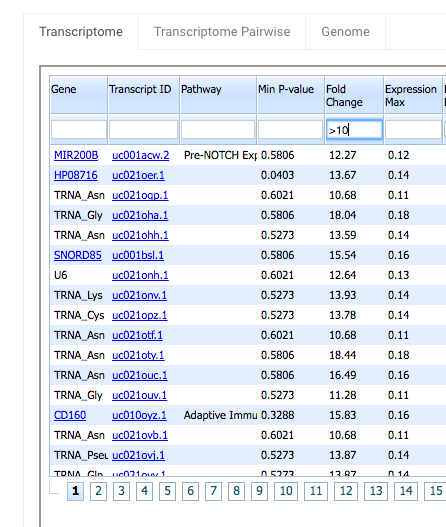
Fold Change – This is the maximum pairwise fold change (ratio of expression) among the sample groups. Again you can use Fold Change’s search field to filter your results. Type “>10” in the Fold Change search field to see rows with Fold Change greater than 10.
Expression Max – This is the highest expression value among all sample groups. This is useful as a noise filter to remove low level stochastic genomic transcription products from your results page.
Differentially Expressed? – The “Differentially Expressed?” value for a gene/transcript can have 2 values:
1 – Differentially Expressed
0 – Not Differentially Expressed
A gene is considered differentially expressed if 2 criteria are met. First the sum of the highest and lowest expression values must be greater than or equal to a cutoff of 1 rpkm. Second, the fold change must be greater than or equal to the value selected in the “Min Fold Change” column (2,5,10 or you can leave it blank).
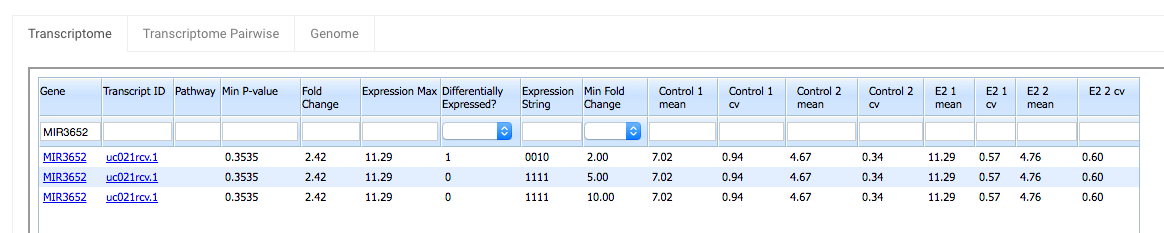
For the gene MIR3652:
Highest expression = 11.29
Lowest expression = 4.67
11.29 + 4.67 = 15.96 > 1
The first criteria is met.
Fold Change = 2.42
The second criteria is met when Min Fold Change is set to 2, but not when it is set to 5 or 10.
Thus the Differentially Expressed? flag is 1 in the row with a Min Fold Change of 2, but it is 0 in the other two rows.
Note that the differential expression column does not take the FDR corrected p value into account. A gene could have a 1 in the “Differentially Expressed?” column, but that doesn’t necessarily mean it has a significant p-value. Rather the “Differentially Expressed?” column can act as an additional noise filter for your data set.
Expression String – You can use expression strings to search for genes/transcripts in your data that are highly expressed in some sample groups but expressed at a low level (or not at all) in others. The expression string consists of 1’s and 0’s and its length will be equal to the number of sample groups in your data set. 0 indicates that the gene has low expression. 1 indicates high expression. In this example, there are 4 sample groups, Control-1, Control-2, E2-1 and E2-2. An expression string of 0011 will filter for genes where expression is low/off for Control-1 and Control-2 and high/on for E2-1 and E2-2. This can be useful for sorting data by hypothesis. The threshold for a gene to be considered on is determined by the value of the Min Fold Change column.
Mean – This is the mean expression in rpkm for all samples within a group.
cv – This is the coefficient of variation. It is the standard deviation divided by the mean for that sample group.
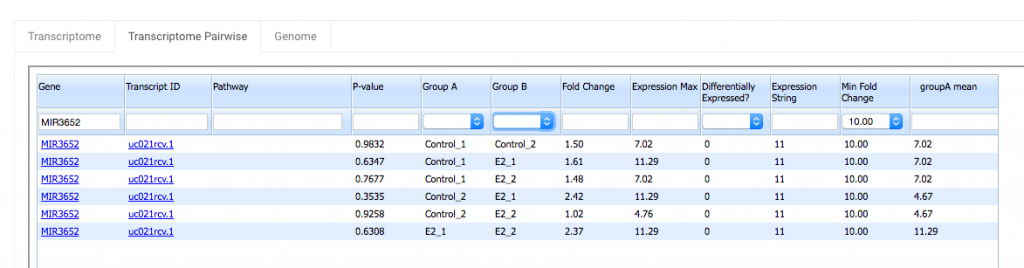
The Transcriptome Pairwise tab is similar to the Transcriptome tab, but with a couple of extra columns, Group A and Group B. These columns allow you to see the results of pairwise tests between one sample group and another. On the Transcriptome tab, you only see the minimum p-value among all the pairwise comparisons made between different sample groups. In the Transcriptome Pairwise tab, you can see all p-values (by leaving Group A and Group B blank), or you can filter the data so that you only see the comparisons between two sample groups that you select. So if you’re interested in comparing two specific sample groups in an experiment that has several groups, you’ll get a lot of use out of the Transcriptome Pairwise tab.
