1 graph that will give you a new perspective on your sequencing experiment
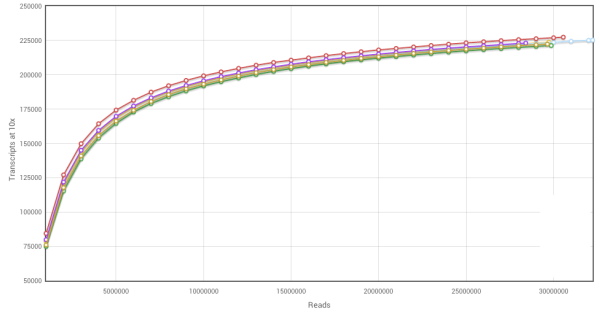
You’ve heard us talk plenty of times before on this blog about saturation curves. We generate them for every project because they’re incredibly powerful in helping to understand a sequencing experiment. To that end, I thought I’d walk through several specific examples to give you an inside look at how we interpret saturation curves. Here is a … Continue reading 1 graph that will give you a new perspective on your sequencing experiment
0 Comments