In this blog post, I will be talking about process noise or variability. This is something that we have been thinking a lot about lately and thought it would be a good time to let you know what we found out.
I will be using the terms bias, variability and noise. So we’re all on the same page, this is how I plan to use these terms in the post:
1. Bias – how far is a group of measurements from a known measurement (skewedness).
2. Variability – how close are a group of measurements (standard deviation).
3. Noise – all of the above…. both bias and variability.
What is cool is that even noise is not always random, hmmm…… maybe all bias is noise, but not all noise is bias?
Ok, enough…
There are numerous papers and much talk about what library kit is best for FFPE RNA-samples (1) or if polyA purification causes less data bias than ribosomal removal (2). In most cases, the testing is done with technical replicates to isolate variability to the library prep only. But, at Cofactor, the thing we have been obsessed with over the last 6 months is process noise. It is interesting that I was not able to find any papers examining process noise and have not heard it talked about in our industry. My suspicion is it’s because process noise changes depending on the pipeline and application. It can be complicated to assess and it’s a scary process!! You just throw the closet door open and start shining a 300 lumen light around. Not so cool, but we want to be generating data at the highest level possible while being open about our process and the noise it injects. I honestly believe that the below statements about Cofactor’s process noise sets a benchmark in our industry, that thus far has gone unmet!
Today…. we meet it!
I want to first talk about noise in RNA-seq data. There are three types of noise in RNA-seq data, biological noise from variability in the biology of the samples, process noise which I will talk about more below, and sampling noise. Sampling noise (or error) is usually filtered from RNA-seq data during analysis and thus is a extremely small component in comparison to biological and process noise. There are quite a few people that spend A LOT of time trying to quantify batch noise in sequencing data, which is a component of process noise. However, I am going to tell you why this noise is minimal enough that it does not warrant such a deep dive.
Let’s talk a little about Cofactor’s concept of process noise. Process noise is variability injected into the data by the front-to-back RNA seq pipeline. We can think of process noise emanating from three areas of the pipeline:
1. Molecular noise – Noise from anything upfront of getting a sample on a machine. Examples include, technicians on different days, pipetting errors, molecular variability (usually involves some kind of priming and cDNA generation). The amount of noise can change as amplification cycles increase or different kits are used.
2. Machine noise – noise specific to the sequencing process such as cluster generation, lane to lane variability as well as the molecular biology of sequencing.
3. Analysis noise – noise from an analysis pipeline which causes data variability, such as quality trimming, alignment parameters, normalization, etc.
So, we have acknowledged, and I think we can all agree that these areas can cause noise, variability, and bias in RNA-seq data.
Ok, so what do we do now?
First, we have to think about how to measure process noise, what samples do we use, what library kit, how do we analyze the data and how do we visualize/represent it?
One can assess process variability several ways; generate libraries, sequence, and align data from technical replicates or use RNA control spike-ins across a sample cohort (these are essentially technical replicates as long as you made your dilutions, very carefully, from the same stock).
Cofactor took a look at both examples I mention above, total RNA technical replicates and Cofactor’s optimized set of 24 RNA control spikes.
As opposed to the testing and papers mentioned above, which evaluate different library construction kits and molecular manipulations, we decided to employ one type of library kit for each sample type (100 ng FFPE-RNA into the NuGen V2 and 250 ng mRNA into the Kapa Stranded with RNA control spikes). Also, we made sure the testing was performed with the same lot of kit, however libraries were generated on different days and run on different lanes of the sequencer (if you think I am going to give you a full Mat & Meth here, you are crazy…. go figure out how to do this with your own samples). We fou the urge to test a bunch of normalization techniques and just stick to our tried and true. In many ways, this experiment is really boring because we essentially do not want to change anything, just make a bunch of libraries from relatively normal samples….. NORMAL is the important part here, as in the kind of samples you would encounter with your RNA-seq clients.
Technical replicate libraries were generated from FFPE RNA samples and sequenced to between 15-20 MM single-end reads. The reads were aligned, normalized, and the ratio of transcript coverage between technical replicates calculated. RNA control spikes were added to 5 separate experimental RNA-seq samples immediately following RNA extraction and the samples were sequenced to approximately 30 MM single-end reads. The ratio of coverage for spikes was pairwise compared across all 5 samples for a total of 10 comparisons. As I mentioned above, one of our goals for these experiments was to generate data from our standard sample types and procedures.
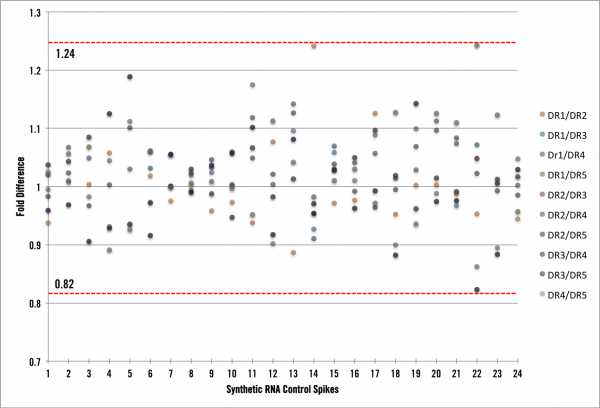
What we found was very informative! First, we now have the process and infrastructure to test new pipeline procedures (kits, automation platforms, normalizations, etc) and calculate the impact they have on the process noise component. Ultimately, we want to be implementing changes that reduce our noise to the lowest possible level. Second, we can now speak directly to the amount of “Cofactor noise” in the data. The graph below shows RNA spike data with a maximum variability of +/- 24%. For the FFPE samples, we observed a slightly higher variability, which is to be expected, of +/- 30% (data not shown).
What does all of this mean?
First, what would the graph look like if we had absolutely zero process noise? There would be zero fold difference of average coverage across all of the samples, thus each point would lie exactly on a fold difference of 1. However, we see here that is not the case, so we have process noise in our data and in the most simplistic terms it means that our full end-to-end RNA seq pipeline is inducing ~25% variability. As mentioned above our FFPE RNA-seq pipeline is inducing ~30% variability in the data we generate. Is this low or high? Well, lets put these amounts into context of an RNA-seq experiment and show you how low it is. Under normal circumstances, the lowest fold-change cutoff our clients would use to derive candidates is around 3x or 300% difference (most would be using > 4x). We can use this cutoff to characterize our process variability by stating that when a transcript shows a 3x or greater fold change, less than 10% of that difference is due to noise in Cofactor’s system. This is pretty awesome! In fact, we had no idea beforehand what the process noise experiment would show (lest we bias ourselves). Let’s think of this one more way and say a researcher wants to use 4-fold or greater as their cutoff for deriving differentially expressed candidates from FFPE samples. At that level, candidates could be either 4.3 or 3.7 fold different. Pretty cool…. right! Less than 10% noise with FFPE samples at 4-fold or greater is excellent.
Lastly, I made this statement at the top of the post:
“There are quite a few people that spend A LOT of time trying to quantify batch noise in sequencing data, which is a component of process noise. However, below I am going to tell you why this noise is minimal enough to not warrant such a deep dive.”
I want to speak to this statement. The real question that the people I mention above are trying to figure out……”is there enough variability injected by the process of generating data that I need to account for it in my final analysis model”? I am here to tell you that, at least with Cofactor’s pipeline, biological noise is greater than process noise (in most cases), by 5 – 10 fold. Hopefully in the future, the same amount of attention will be given to how biological replicates are designed and collected as spent on how much noise different lanes of sequencing inject into the final data output.
At the end of this blog post, I will cop to the knowledge that all noise is additive from the beginning of the process to the end, and a reduction in one part affects the whole. Cofactor has decided to deduce and work on reducing our level of process noise with the hope that others, handling other parts of the process, will do the same. It’s all part of our commitment to being the best sequencing provider. We want to empower researchers with the data and analysis behind their work. Process noise is a big part of that.
Next time, we are going to compare biological noise and process noise to show you how we arrive at the 5 – 10 fold difference. Thanks!
1. Comparative analysis of RNA sequencing methods for degraded or low-input samples.
Adiconis X, Borges-Rivera D, Satija R, DeLuca DS, Busby MA, Berlin AM, Sivachenko A, Thompson DA, Wysoker A, Fennell T, Gnirke A, Pochet N, Regev A, Levin JZ. Nat Methods. 2013 Jul;10(7):623-9
2. IVT-seq reveals extreme bias in RNA-sequencing.
Lahens NF, Kavakli IH, Zhang R, Hayer K, Black MB, Dueck H, Pizarro A, Kim J, Irizarry R, Thomas RS, Grant GR, Hogenesch JB. Genome Biol. 2014 Jun 30;15(6):R86.