Multidimensional Gene Expression Models for Characterizing Response and Metastasis in Solid Tumor Samples
Identifying robust biomarkers that accurately predict response to therapy prior to treatment is the holy grail of precision medicine. The work that our pharma partners are undertaking to identify biomarkers for companion or complimentary diagnostics will prove to be powerful in improving patient care in the near future. However, there are still many patients that are being treated with standard of care (SOC) therapies, such as chemotherapy and radiation, in today’s clinics. Predicting outcomes such as survival status before these treatments are delivered, AND monitoring immune response post-treatment with the goal of tailoring therapeutic regimens could be powerful tools for clinicians – available immediately.
Cofactor recently partnered with TriStar Technology Group to undertake a series of small proof of concept studies aimed at demonstrating the utility of immune monitoring and predictive modeling within multiple indications. At the American Association of Cancer Research (AACR) Annual Meeting in Atlanta this April, we presented the results for one of these studies, focused on non-small cell lung cancer.
We are very grateful for the partnership of TriStar. If you’re not familiar, they are a leading provider of archived human bio specimens and related research services offering highly-characterized and well-curated donor samples with extensive clinical follow-up data. We would not have been able to identify these interesting biomarkers without the valuable meta data that TriStar has curated alongside their patient materials.
You can find a PDF version of the poster available for download here.
In brief, TriStar provided a matched set of specimens from 7 patients, consisting of solid tumor tissue from matched pre and post treatment biopsies from patients diagnosed and treated for NSCLC. The samples were all collected within the last 10 years, and represent patients who were treated with standard of care therapies including chemotherapy and radiation. Patients include both males and females, median age 61 at time of primary diagnosis, all of caucasian descent, with a mixed history of drinking and smoking. For those patients tested, no EGFR or ALK mutations were detected by molecular assay. All patients showed relapse of disease – either recurrence or metastasis. This information is summarized in Table 1 on the poster.
We processed each patient specimen through the ImmunoPrism Assay, which reported an individual ImmunoPrism Immune Profiling Report, such as the one shown below.
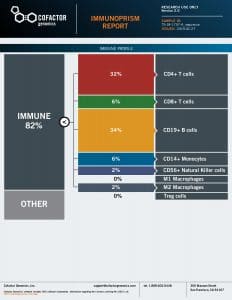
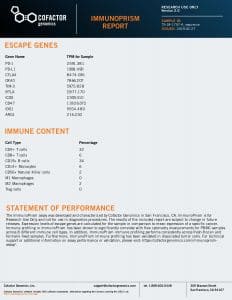
Note that two types of analytes are reported in these reports: (1) Immune Cell Content – individual immune cells are quantified and reported as the % of total cellular content. This value is absolute, and may be compared within (intra) and between (inter) samples. (2) Immune Escape Gene Expression – key genes known to be involved in immune escape are reported as transcripts per million (TPM).
Using the individual ImmunoPrism Immune Reports, we were able to look not only at the immune profiles pre-treatment, but also how the immune landscape changed post-treatment. Examples of plots comparing pre and post treatment samples from individual patients are shown in Figures 2a and 2b, and the median values for all patients are summarized in Figure 2c.
The most interesting signals were observed when we compared the “delta” values, or the change in immune signals between pre and post treatment. When comparing groups of samples, the delta value is the median of pre minus post values for all samples in the group. In this study, we report delta values as (+) if the value increased post-treatment, and (-) if the value decreased post treatment.
The samples were grouped by two major “outcomes” measures – the first being Survival Status (whether or not the patients were reported to be “Alive” or “Deceased”; ), and the second being Time to Progression. For Time to Progression, a threshold of 18 months was used.
First, we looked at how the changes in overall immune content (all immune cells) varied between the Survival Status. These delta values are shown in Table 3 on the poster. In this Table, you can see that the overall immune content decreased post treatment for patients who survived, and increased slightly for patients who did not survive. Given that immune infiltrates are usually regarded as a proxy for positive prognosis, this was an interesting finding. It also demonstrates that it is important to look deeper into the quantification of specific cell types.
The delta values for individual cell types and escape genes and their role in predicting Survival Status are shown in Figures 4a (Escape Genes) and 4b (Immune Cells). Interesting signals (deltas where a sign change was observed) were highlighted in yellow on these plots.
The same analysis was performed using Time to Progression as an outcome metric for grouping patients. These results are summarized in Figures 5a (Escape Genes) and 5b (Immune Cells), with interesting signals again highlighted in yellow.
Finally, I’d like to highlight the powerful utility of the ImmunoPrism Biomarker Report, which looks specifically at pre-treatment samples to identify predictive biomarkers. Using the Time to Progression grouping, we identified two escape genes (CD47 and OX40) whose expression is statistically-predictive (p<0.05) of this outcome, shown in Figure 3. The gene OX40 specifically is generally not considered highly abundant in the tumor microenvironment, so it is particularly exciting to demonstrate the value of the sensitivity of the assay with this result.
View the full ImmunoPrism Biomarker Report for this Clinical Outcome here.
As described in the poster, we intend to add additional samples to this study to increase the statistical power and further demonstrate the utility of these results. However, we are certain that clinicians will find utility in the ability to monitor the changing immune landscape in individual patients throughout a treatment regimen, to enable improved decision making for treatment modifications based on biomarkers such as the ones described here. Today, many patients are not only receiving a first line of therapy, but often a second and third line. Better understanding how and when to administer these is important, and can be aided by information such as what is demonstrated in this study.
This data represents an exciting demonstration of the clinical utility of the ImmunoPrism assay, and it would not be feasible without the extensive technical and clinical validation work we’ve reported on previously. If you’re interested in why we chose to clinically-validate our ImmunoPrism asasy under the CAP guidelines, you can learn more about the CAP requirements and results of our clinical validation study in our recent webinar.
If you’d like to discuss these results further, or speak with our team to design a study using your patient materials, please Contact Us and we’d be happy to support your translational or clinical studies.
Note: Cofactor’s ImmunoPrism™ Assay is offered both for Research Use Only (not to be used as a diagnostic assay) and as a CAP-validated assay. All stages of the assay were performed in a research environment for the results described in the poster referenced here. Please contact us to discuss which option is right for your application.
